
Automated Testing and Log Parsing

Vlad Horbach
Friday, July 11, 2025
During the maintenance and development of an IoT system, our client identified the need to improve the reliability and convenience of network activity analysis. Initially, the system used text-based logs for data storage, which, under conditions of limited resources and high event density, led to difficulties in maintenance, analysis, and debugging. A comprehensive solution was implemented, including a transition to a binary log format and an automated testing system. This article describes the problem identification process, the proposed effective solution, and the resulting improvements in usability and reliability.
System architecture
The system includes three main components: a single coordinator running Linux-based OS on a Raspberry Pi, several routers, and numerous endpoint devices. Data exchange is carried out over a ZigBee wireless network built on a mesh topology, which ensures flexible routing and resilience to individual node failures. Each endpoint transmits vibration and temperature measurements to the coordinator at predefined times, individually configured for each node, or upon reaching certain threshold values. This strategy enables efficient power management, which is especially important for autonomous battery-powered devices.
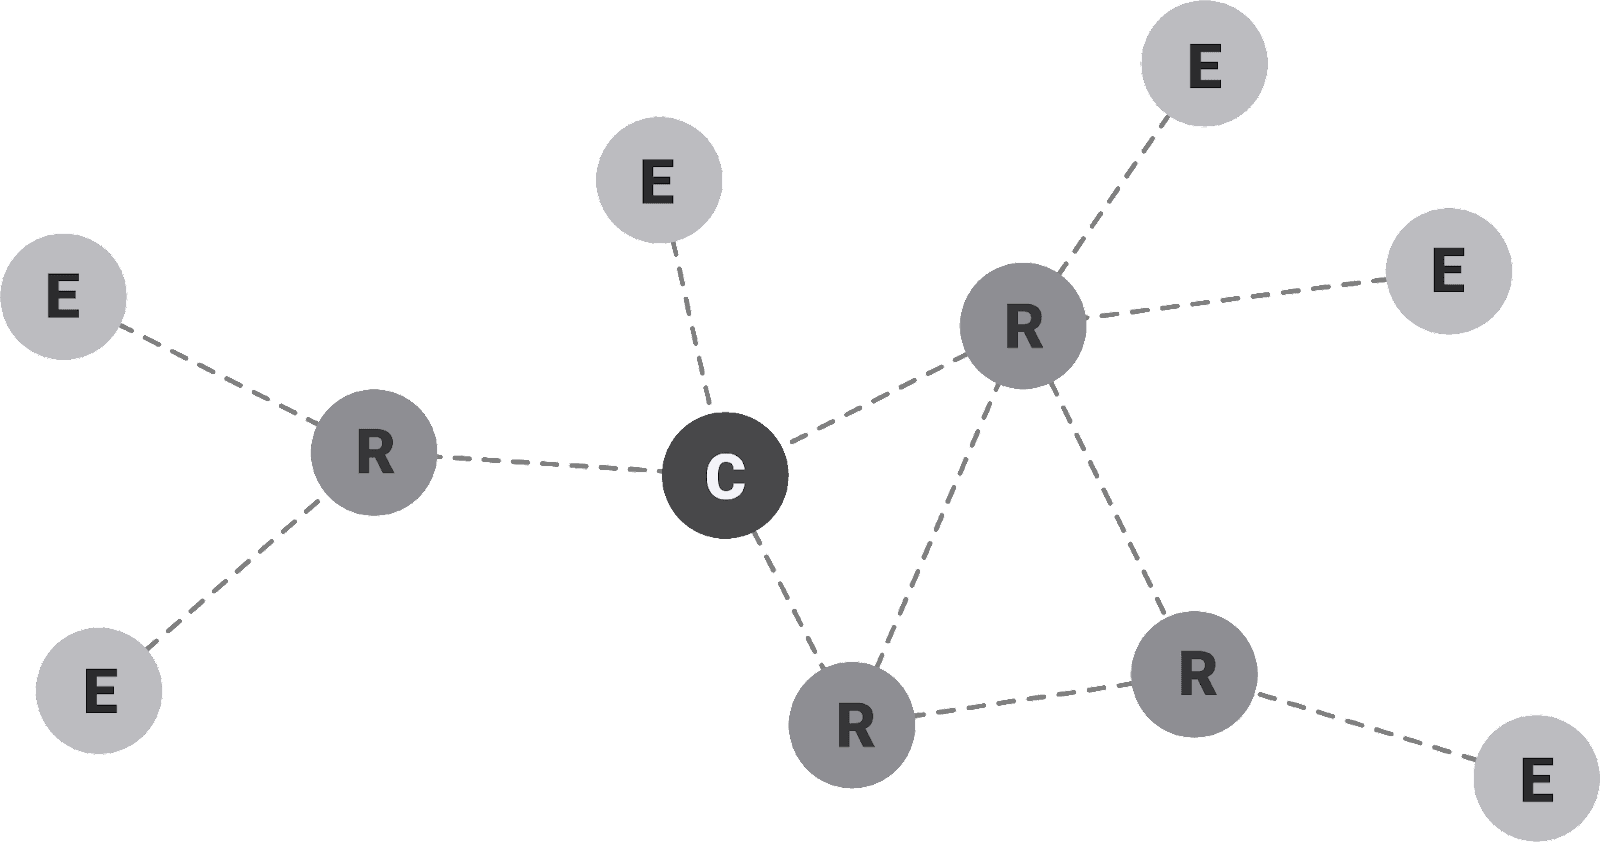
Scheme of interaction of devices in the Zigbee network
Data transmission can occur either directly or via intermediate routers, depending on signal quality and the distance to the coordinator. This ensures network stability and continuous data collection even under challenging radio conditions.
Text logs
Due to limited memory capacity, all logs are stored on the coordinator. All of its services, including network modules, protocol handlers, task schedulers, and system monitoring, recorded diagnostic information in a single shared text log file. Each service used its own string format, which was not always consistent with other components.
This scheme has several significant drawbacks:
Excessive log volume: The text format occupied considerable space, especially with frequent file rotation. Each line contained numerous text fields, often duplicating structural information necessary only for event identification. This not only increased overall file size but also slowed down subsequent processing. Additionally, as logs accumulated over extended periods, storage requirements grew, necessitating regular cleanup or archiving and complicating long-term retrospective analysis.
SD card wear: Continuous logging and frequent file rotation significantly increased write operations, particularly during high system activity. Given the limited rewrite cycles of SD cards, this accelerated wear, reduced reliability, and heightened the risk of read/write errors. Over time, this could lead to premature SD card replacement and additional maintenance costs.
Data loss: Log files were generated at one-minute intervals - each file was first written to RAM and then archived. During high event generation rates, some entries failed to be logged before rotation, resulting in partial data loss, especially under peak loads. This reduced diagnostic accuracy and complicated event chronology reconstruction.
Analysis complexity: Custom log line formats from different services hindered automated processing. Each line required preliminary parsing: identifying the originating service, recognizing its structure, extracting key parameters, and converting them into an analyzable format. This increased processing time, complicated the development of a universal parser, and hindered scalability when adding new system components.
Additionally, a visual parser with a graphical interface was developed to parse text logs and display measurements and events as graphs. This solution significantly simplified studying system behavior over time, enabling tracking of metric trends and correlating events with measurements.
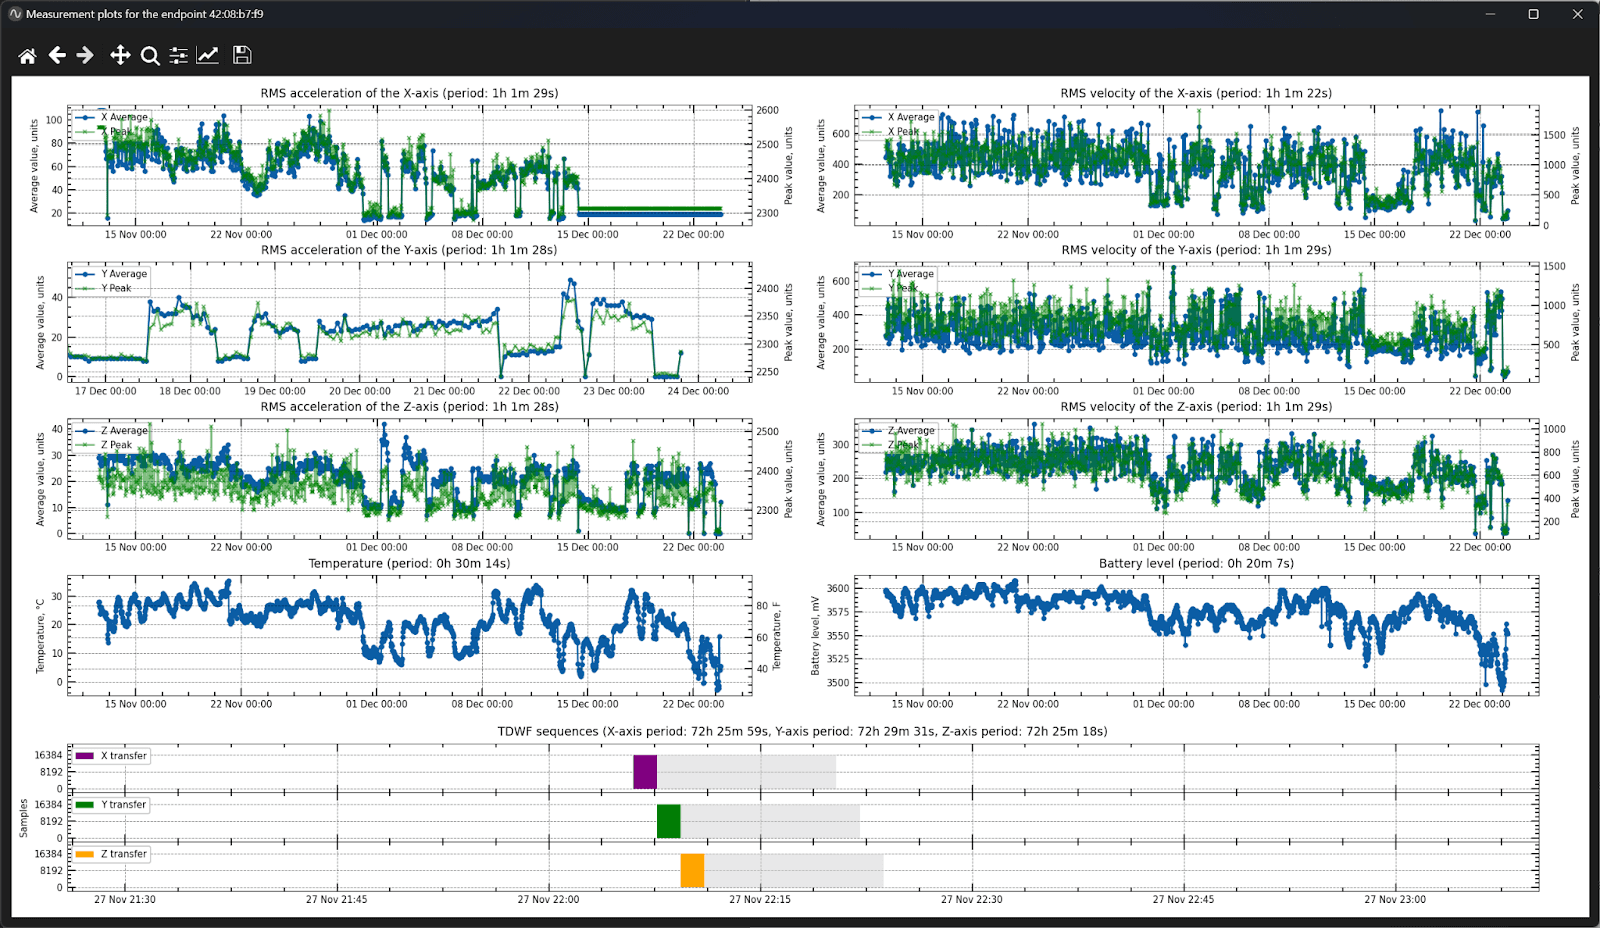
It allowed quick anomaly detection, activity period visualization, and identification of abnormal device behavior. However, when handling large log volumes, performance sharply declined: line-by-line analysis required processing each entry individually, demanding substantial computational resources and increasing overall file processing time.
Binary logging
A rational step was transitioning to a binary logging format using Google's FlatBuffers library. FlatBuffers enables efficient serialization of structured data into a compact binary form while allowing direct field access without deserialization. Data is now recorded in a tightly packed binary format following a strictly defined, unified schema shared across all system components.
Advantages of the FlatBuffers binary format:
Compactness: Binary records occupy significantly less space compared to text logs.
Reduced storage load: Fewer write operations decrease SD card wear.
Fast access: Individual fields (e.g., timestamps or event types) can be accessed directly without parsing the entire record.
Filtering and sorting: The uniform structure simplifies filtering events by any parameter and quickly analyzing relevant segments.
Reliability: The strict schema ensures log integrity, minimizes errors, and supports seamless scalability as the system evolves.
Cross-platform support: FlatBuffers is compatible with multiple programming languages, easing integration with analytics and monitoring tools.
The program previously handling text logs was refactored to support the binary format. Processing binary files proved significantly faster by eliminating the need to deserialize each entry. Recent data for a given period is now stored in memory and directly accessible. This enables real-time SSH data retrieval and immediate visualization without delays, greatly simplifying system debugging and monitoring.
Manual testing
Initially, endpoint health checks were performed manually. This required executing a predefined sequence of steps from a checklist, including activating various device operating modes and logging all events. After testing, a thorough manual analysis of the logs was necessary.
Even with a graphical interface for data visualization, processing large volumes of information remained labor-intensive and error-prone: critical events could be overlooked, especially if they were subtle or temporally dispersed. This significantly reduced testing accuracy, hindered the detection of rare anomalies, and prevented scalability as the number of devices increased.
Automated testing
To overcome the inefficiencies of manual testing, we developed a comprehensive automated testing framework for the IoT system. This solution ensures consistent validation of all network components while minimizing human intervention and maximizing reliability.
Key features:
Structured test definitions
Tests are defined using JSON configurations, allowing flexible customization for different device types and scenarios.
Supports both default test sets (applied to all devices) and custom tests (tailored for specific endpoints).
Comprehensive test coverage
Sensor Validation: Automated checks for battery levels, accelerometer bias, and temperature readings.
Performance Metrics: Verification of RMS calculations and time-domain waveform processing.
System Robustness: Tests for OTA updates, hibernation recovery, and coordinator reboot stability.
Efficient execution
Tests can be launched via a user-friendly GUI or command-line interface, with results stored for analysis.
Real-time Monitoring: The system logs anomalies and generates alerts, enabling quick troubleshooting.
Scalability and maintenance
Dynamic Configuration: System parameters can be adjusted without code changes, simplifying updates.
Automated Reporting: Detailed reports provide insights into test outcomes, helping identify trends and potential issues.
The automated testing system has reduced manual effort, improved accuracy, and accelerated deployment cycles. By standardizing validation processes, it ensures consistent performance across the entire IoT network, enhancing overall system reliability.
Conclusion
The comprehensive approach combining binary logging and test automation has become a key factor in enhancing system stability. By abandoning text logs, we significantly reduced filesystem load, accelerated data access, and minimized the risk of data loss. The binary structure formalized the record format, simplifying event filtering, aggregation, and analysis.
Simultaneously, the automated testing system minimized operator involvement, eliminated human error, and enabled real-time device performance monitoring. Background and scheduled checks covered both standard scenarios and edge cases, facilitating prompt anomaly detection and reducing response time to potential failures.
These improvements not only resolved existing issues but also simplified maintenance, enhanced scalability, and reduced operational costs for the IoT infrastructure. The implemented solutions created a robust foundation for future system expansion while optimizing resource utilization and reliability.


